Most advice about timing a Big Hole trip comes down to one word: June. It is not wrong, but it hides more than it tells.
The United States Geological Survey has measured the Big Hole River at Melrose since 1923. That is more than a hundred years of flow records, with water temperature added in 1995. We pulled the numbers.
They tell a clearer story than any “best month” rule of thumb.
The shape of the Big Hole’s year
The river runs on snowmelt. The data shows the same arc almost every year, just bigger or smaller depending on the winter.
Median monthly flow at Melrose across the full record, in cubic feet per second:
- Winter, December to February: around 340 to 350
- March: about 430
- April: about 1,300
- May: about 2,900
- June: about 3,800, the yearly peak
- July: about 1,100
- August: about 380
- September: about 300, the yearly low
- October to November: a small bump, around 460 to 470
The June peak runs about twelve times higher than the September low. The whole fishing question lives inside that curve.
Why “June” is misleading
June is the peak, but peak flow is not peak fishing.
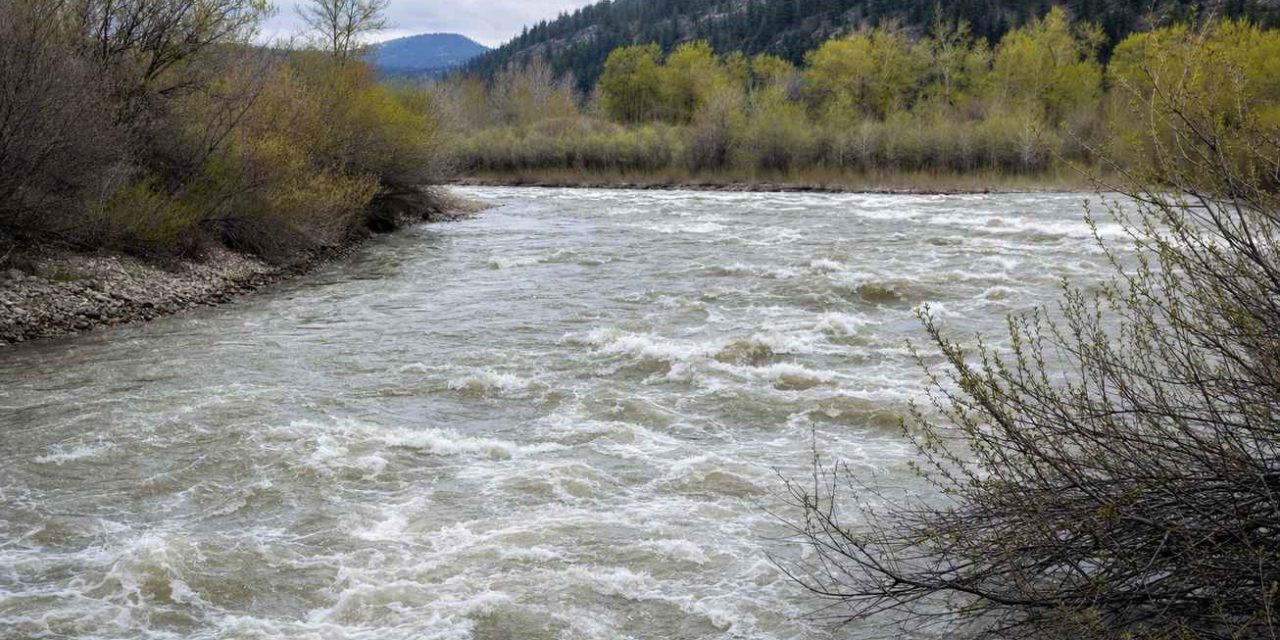
June is when the river is highest, not when it is best. In a normal year the early part of the month is still pushing snowmelt: high, cold, and often off-color. The water you want is the descending limb, when flows drop off that peak and the river clears.
That is also when the famous salmonfly hatch rides upstream. The hatch tracks the warming, dropping water, not a date on the calendar. So “June” is shorthand for a moving target, not a reservation window.
The calendar lies, and the data proves it
Here is the number that should change how you plan.
Across the record, the average flow in June has ranged from about 800 cubic feet per second in a drought year to more than 8,300 in a heavy snow year. That is a tenfold swing in the same month.
A June trip in a low year and a June trip in a big year are not the same trip. One is dropping and clearing early; the other is still blown out. The date told you nothing. The snowpack and the spring weather told you everything.
This is why we keep pointing people at the live gauge. The USGS gauge on the Big Hole at Melrose shows the river in real time. Read the current flow against these medians and you will know more than the calendar ever could.
The late-summer risk the numbers expose
The flip side of the curve is the danger zone.
August and September are the lowest-flow months, around 380 and 300 cubic feet per second. Low water warms fast, and the temperature record backs this up.
In the drought summer of 2021, the daily high water temperature at Melrose topped 68 degrees Fahrenheit on 37 days across July and August, and peaked near 74.
That matters because trout get stressed and start to die in warm water. When temperatures climb, Montana Fish, Wildlife and Parks imposes “hoot owl” restrictions that close fishing from afternoon into the night, and in bad years closes stretches outright. The standard trigger is water reaching about 73 degrees for three days running.
A late-summer Big Hole trip carries a real chance of restricted or closed water. The data does not say avoid it. It says plan for it: fish the mornings, watch the temperatures, and check current rules with Montana Fish, Wildlife and Parks before you go.
How to use this
The data turns “when should I go” into something you can actually reason about.
- Do not book on the calendar alone. Book on the snowpack and the gauge. A flexible window beats a fixed date.
- Target the descending limb. As June flows fall off the peak and the water clears, you are in the best window, hatch or no hatch.
- Treat late summer as conditional. August and September can fish beautifully in a wet year and close in a dry one.
- Watch the gauge, not the brochure. Real-time flow against the long-term median tells you what kind of year you are walking into.
For the season-by-season version in plain language, see our guide to the best time to fish the Big Hole. For where to base, start with choosing a cabin for the Big Hole, and for the fishing itself, our notes on fly fishing the Big Hole.
A note on the data
The figures here come from the USGS streamgage on the Big Hole River at Melrose, station 06025500, which has recorded flow since 1923 and water temperature since 1995. Monthly figures are medians of the monthly mean flow across the full record, rounded. Restriction policy is from Montana Fish, Wildlife and Parks.